
How to Build a Context Graph: Infrastructure for Organizational Intelligence
- Jan 5
- 6 min read
Your organization is drowning in data but starving for intelligence. Every day, thousands of decisions flow through your systems, each one a breadcrumb trail of organizational wisdom. Yet most companies treat these decision traces like exhaust fumes, letting them dissipate into digital oblivion while obsessing over static dashboards that tell them what happened, not why it happened or how to make it happen better next time.
This is the fundamental flaw in how we think about organizational intelligence. We've been building data warehouses when we should be building context graphs. The difference isn't just technical: it's philosophical.
The Static Data Delusion
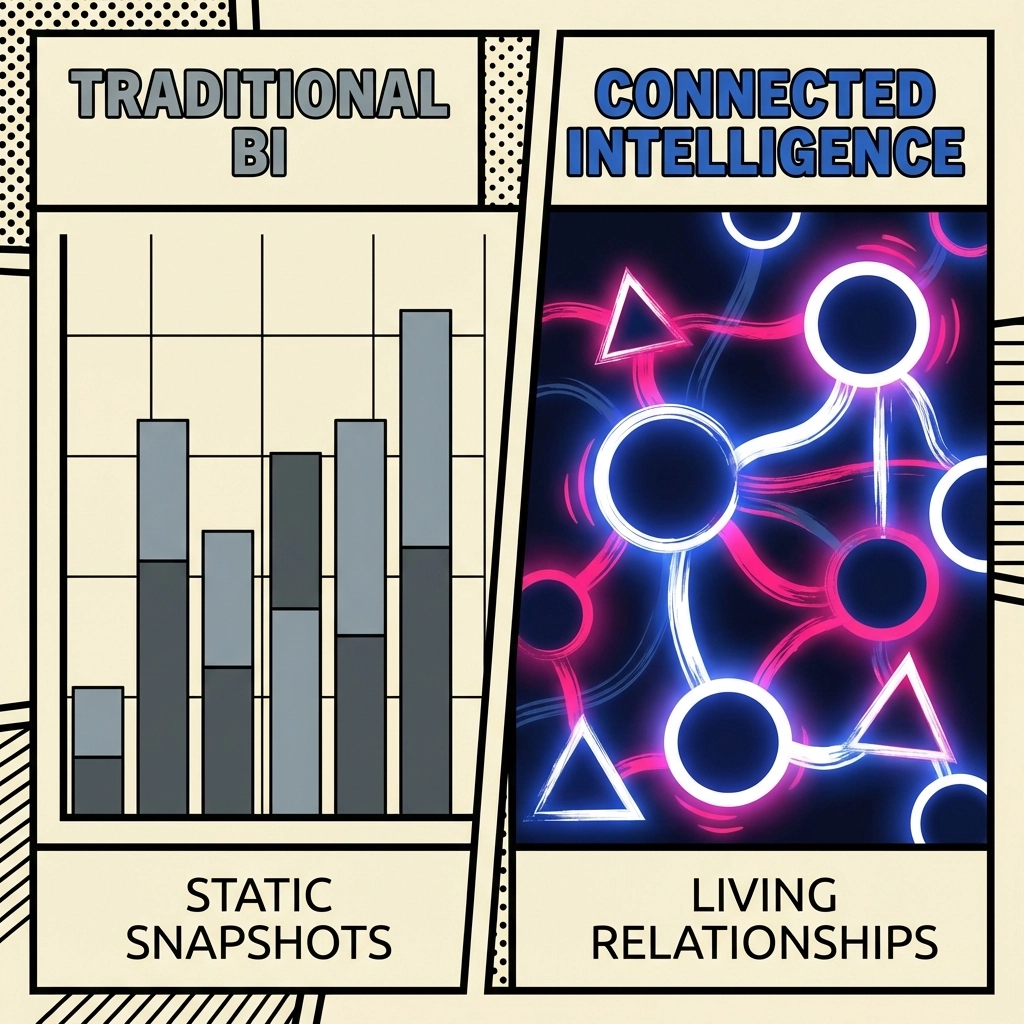
Traditional business intelligence operates on a flawed premise: that organizational knowledge can be captured by taking snapshots of data at regular intervals. Revenue this quarter, customer counts, pipeline metrics, system performance. All useful, all backward-looking, all missing the most valuable asset your organization produces every day.
The real intelligence isn't in the numbers themselves. It's in the invisible web of decisions, relationships, and reasoning that created those numbers. When a deal closes, the CRM records the revenue. But where does it record why the discount was approved, which stakeholders influenced the decision, or how similar situations were handled previously?
This is why most AI automation initiatives fail spectacularly. They're trained on static data patterns instead of decision intelligence. They can predict what might happen based on historical trends, but they can't navigate the nuanced, relationship-driven reality of how organizations actually work.
What Context Graphs Actually Are
A context graph isn't just another database with fancy visualization. It's infrastructure for capturing and connecting your organization's decision DNA. Think of it as organizational memory that gets smarter over time, instead of simply bigger.
Unlike traditional databases that store isolated records, context graphs capture the relationships between entities, the reasoning behind decisions, and the temporal evolution of organizational knowledge. They answer not just "what" but "why," "who," "when," and most importantly, "what should happen next time."
The graph structure mirrors how organizations actually function: as complex webs of relationships, dependencies, and decision flows spanning multiple systems and stakeholders. When someone approves an exception to standard pricing, that decision creates ripple effects across finance, operations, and customer success. A context graph captures not just the approval, but the reasoning, the stakeholders involved, and the downstream implications.
Why Building Context Graphs Is Brutally Hard
The technical challenges are manageable. The organizational ones will break you.
Building a context graph requires capturing decision traces at the exact moment they occur, with all the messy context that humans usually keep in their heads. This means instrumenting not just your systems, but your people's thought processes. It means creating infrastructure that can handle the ambiguity and nuance of real decision-making, not the sanitized version that ends up in your process documentation.
Most organizations fail because they approach context graphs like a data integration project. They try to extract decision intelligence from static records after the fact. But by then, the most valuable information: the reasoning, the alternatives considered, the stakeholder dynamics: has already evaporated.
The real challenge is cultural. Context graphs require people to externalize their decision logic in real-time. This feels like surveillance to many employees, especially when historical decision patterns reveal uncomfortable truths about organizational biases, inefficiencies, or power structures.

The Infrastructure Foundation
A production-ready context graph requires four specialized stores working in concert, each optimized for different types of organizational intelligence:
Graph Store: Captures the relationship web between entities. Who reports to whom, which teams collaborate, how approval chains flow, which systems depend on others. This isn't org chart data: it's the living network of how work actually gets done.
Vector Store: Holds unstructured knowledge that can't be easily categorized. Email threads that led to decisions, meeting notes, strategic documents, customer feedback. The vector store makes this fuzzy information searchable and connectable to structured decision traces.
Rules Engine: Encodes business logic, compliance requirements, and decision policies. But unlike traditional rules engines, this one learns and evolves. When exceptions get approved repeatedly, the engine suggests updating the underlying rule rather than treating each case as an anomaly.
Time-Series Store: Tracks how entities and relationships change over time. Organizations are dynamic systems, and yesterday's decision logic might be obsolete today. The time-series component ensures context remains current while preserving historical decision patterns for learning.
The key insight is treating these as shared organizational infrastructure, not embedded components within individual applications. This prevents the fragmentation that kills most knowledge management initiatives.
The Human-in-the-Loop Bootstrap Strategy
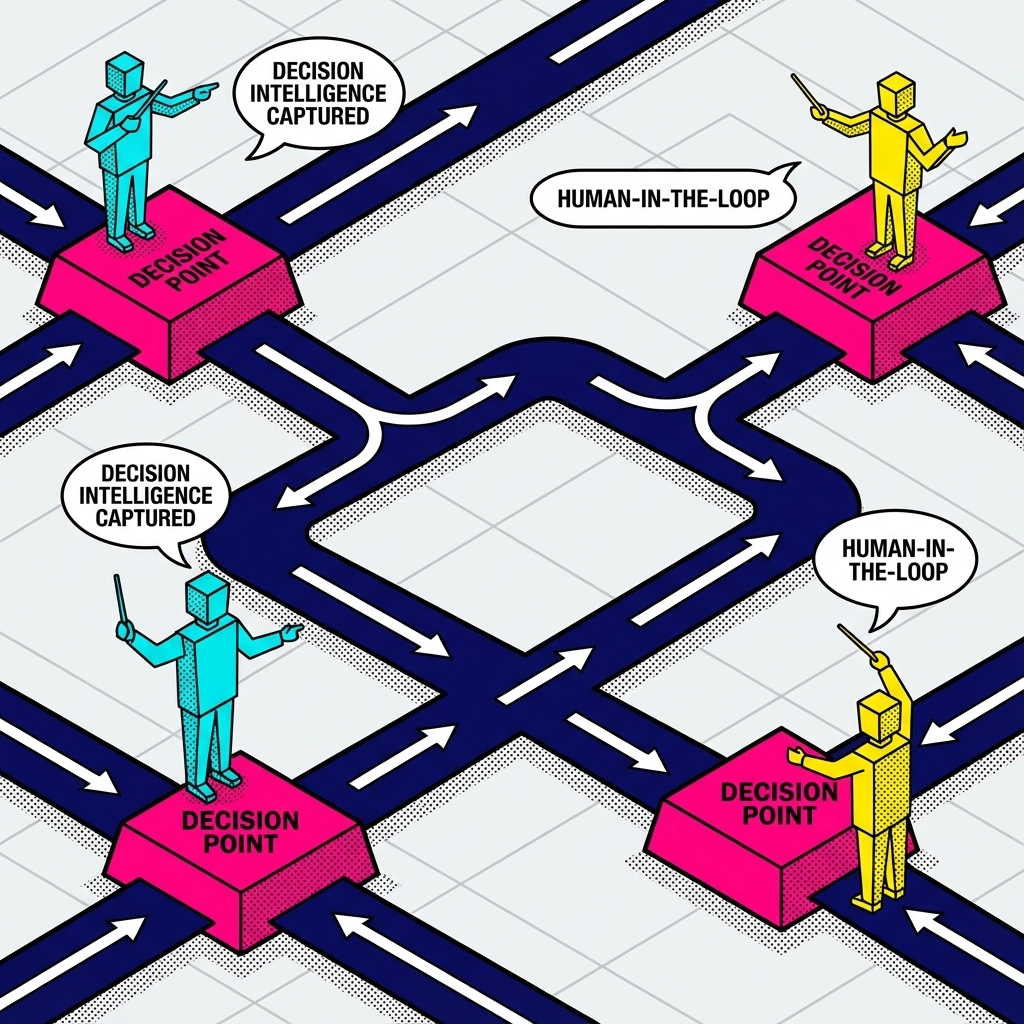
Here's the controversial part: you can't automate your way to a context graph. You have to start with humans in the loop, capturing their decision traces as they work, then gradually automate the patterns that emerge.
Begin by identifying orchestration points in your organization: places where multiple systems and stakeholders intersect to make decisions. These are often found in "glue" teams like RevOps, DevOps, or customer success operations. These teams already see the full context because their job is bridging silos.
Instrument these decision points to capture not just the outcome, but the input gathering process, the alternatives considered, and the reasoning behind the final choice. When someone approves a pricing exception, record which data they reviewed, which stakeholders they consulted, what precedents they considered, and why they decided this case warranted an exception.
This creates what we call "decision DNA": reusable patterns of organizational intelligence that can inform future similar situations. The key is making this capture feel like value-added workflow enhancement, not administrative burden.
From Traces to Intelligence
The magic happens when you accumulate enough decision traces to identify patterns that humans miss. A context graph doesn't just store decisions: it reveals decision archetypes, stakeholder influence patterns, and organizational bias signatures.
For example, you might discover that pricing exceptions are 40% more likely to be approved when requested by enterprise customers in Q4, but only if the request comes through the VP of Sales rather than account management. This isn't just interesting trivia: it's actionable intelligence that can optimize future decision flows.
The graph becomes a living consultation engine. When similar decisions arise, it can surface relevant precedents, identify the right stakeholders to involve, and suggest decision pathways based on successful historical patterns. Over time, routine decisions can be automated while edge cases get routed to humans with full context about how similar situations were handled previously.
The Precedent-Driven Organization
The ultimate goal isn't just better decision-making: it's organizational learning that compounds over time. Instead of repeatedly rediscovering the same edge cases, exceptions become searchable precedent. Instead of institutional knowledge walking out the door with departing employees, decision wisdom accumulates in queryable form.
This transforms how organizations scale. New employees can quickly understand not just what the policies are, but how they've been applied in practice. Decisions become traceable and auditable without being bureaucratic. Knowledge flows horizontally across teams instead of staying trapped in departmental silos.
The maxim here is simple: Precedent beats policy every time. Your formal processes are aspirational. Your decision traces reveal how work actually gets done.
Building Your First Context Graph
Start small, but start systematically. Pick one cross-functional workflow that's painful enough to justify the investment but contained enough to manage complexity. Customer onboarding, deal approvals, incident response, or product launch decisions are common starting points.
Instrument the decision points with lightweight capture mechanisms. Don't try to boil the ocean: focus on capturing the reasoning and stakeholder patterns that currently live only in people's heads.
Build query interfaces that make the accumulated intelligence immediately useful. If people can't quickly find relevant precedents when making similar decisions, the context graph becomes just another data graveyard.
Most importantly, design for evolution. Your first context graph will be primitive compared to what it becomes after a year of organizational learning. The infrastructure should support increasingly sophisticated reasoning as decision patterns become clearer.
The organizations that master context graphs will have a fundamental advantage in an AI-driven world. While competitors struggle with brittle automation that breaks on edge cases, context-graph organizations will have AI agents that understand not just what to do, but why to do it, informed by the accumulated wisdom of every decision that came before.
The question isn't whether your organization will build a context graph. It's whether you'll build it intentionally or let someone else harvest your decision intelligence first.


Comments